Map
The map screen is a full‑page MapLibre GL view that plots every positioned asset on a satellite‑streets basemap. Asset pins are colour‑coded by their worst operational state — alert severity, offline status, or healthy. Click any pin to open the asset detail panel without leaving the map.
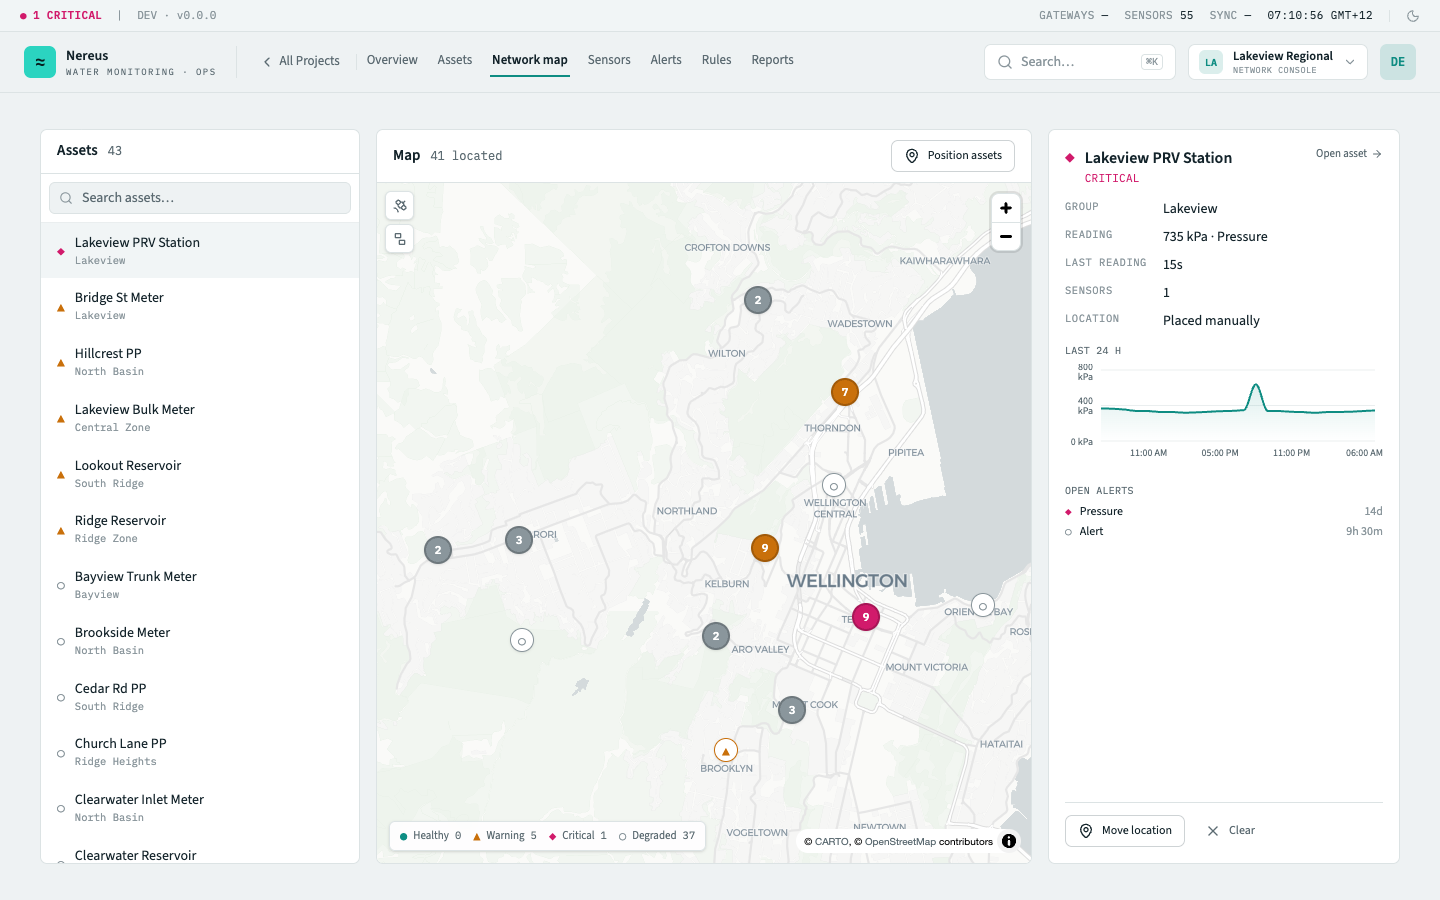
What you see
Section titled “What you see”Asset pins
Section titled “Asset pins”Every asset with a WGS84 coordinate appears as a colour‑coded pin. The pin colour reflects the asset’s worst current state, determined by the most severe active alert on that asset (if any), then falling back to shadow staleness, then healthy:
| Pin colour | Means the asset has… |
|---|---|
| Red | At least one active critical alert |
| Amber | At least one active warning alert, but no critical |
| Grey | No active alerts, but the sensor is offline (stale beyond 6× cadence) |
| Green | No active alerts and the sensor is reporting within staleness threshold |
Planned and decommissioned assets are excluded from the map — they have no coordinates. Assets without a coordinate (positioned later via the asset detail sheet) are not shown.
Asset detail panel
Section titled “Asset detail panel”Click any pin to open a slide‑in panel on the right side of the map. The panel shows:
- Asset name and class with a type chip
- Latest reading as a reading card with a 7‑point sparkline for the asset’s primary metric (reservoir level for reservoirs, flow rate for meters, pressure for pump stations and pressure points)
- Device health strip: battery bar and signal strength indicator from the most recent uplink
A View asset link at the bottom of the panel navigates to the full asset detail sheet on the assets screen.
Zoom and pan
Section titled “Zoom and pan”The map supports standard MapLibre interactions — scroll to zoom, drag to pan, shift‑drag to
box‑zoom. The zoom level is preserved in the URL (?lat=...&lng=...&zoom=...) so the view is
linkable. A Fit all button in the toolbar zooms out to show every positioned asset in the
project.
Layer toggles
Section titled “Layer toggles”A layer control in the top‑right corner lets you toggle visibility of:
- Asset pins (on by default)
- Group boundaries — translucent polygons around each group’s convex hull (on by default at zoom levels that show groups rather than individual assets)
- Labels — asset names under each pin (off by default, toggle on for printing)
When you zoom out past a threshold, individual asset pins fade and group‑level summary pins appear instead — each group pin shows the worst status of any asset within that group.
Key interactions
Section titled “Key interactions”Click a pin — opens the asset detail panel on the right. The panel stays open as you pan and zoom — click a different pin to switch assets, or click the map background to close it.
Drag an asset pin — in the asset detail sheet’s Location tab, dragging the map pin updates the asset’s stored coordinate. The pin colour updates immediately after repositioning.
Open asset from panel — click View asset in the detail panel to navigate to the asset’s full detail sheet on the assets screen.
Layer control — toggle layers from the control in the top‑right corner. Group boundary polygons show the extent of each site or zone on the map.
Related
Section titled “Related”- Assets — the full asset register and detail sheets
- Sensors — device health context for the detail panel’s signal and battery strips
- Assets & groups — the group hierarchy model underlying group boundaries