Alerts
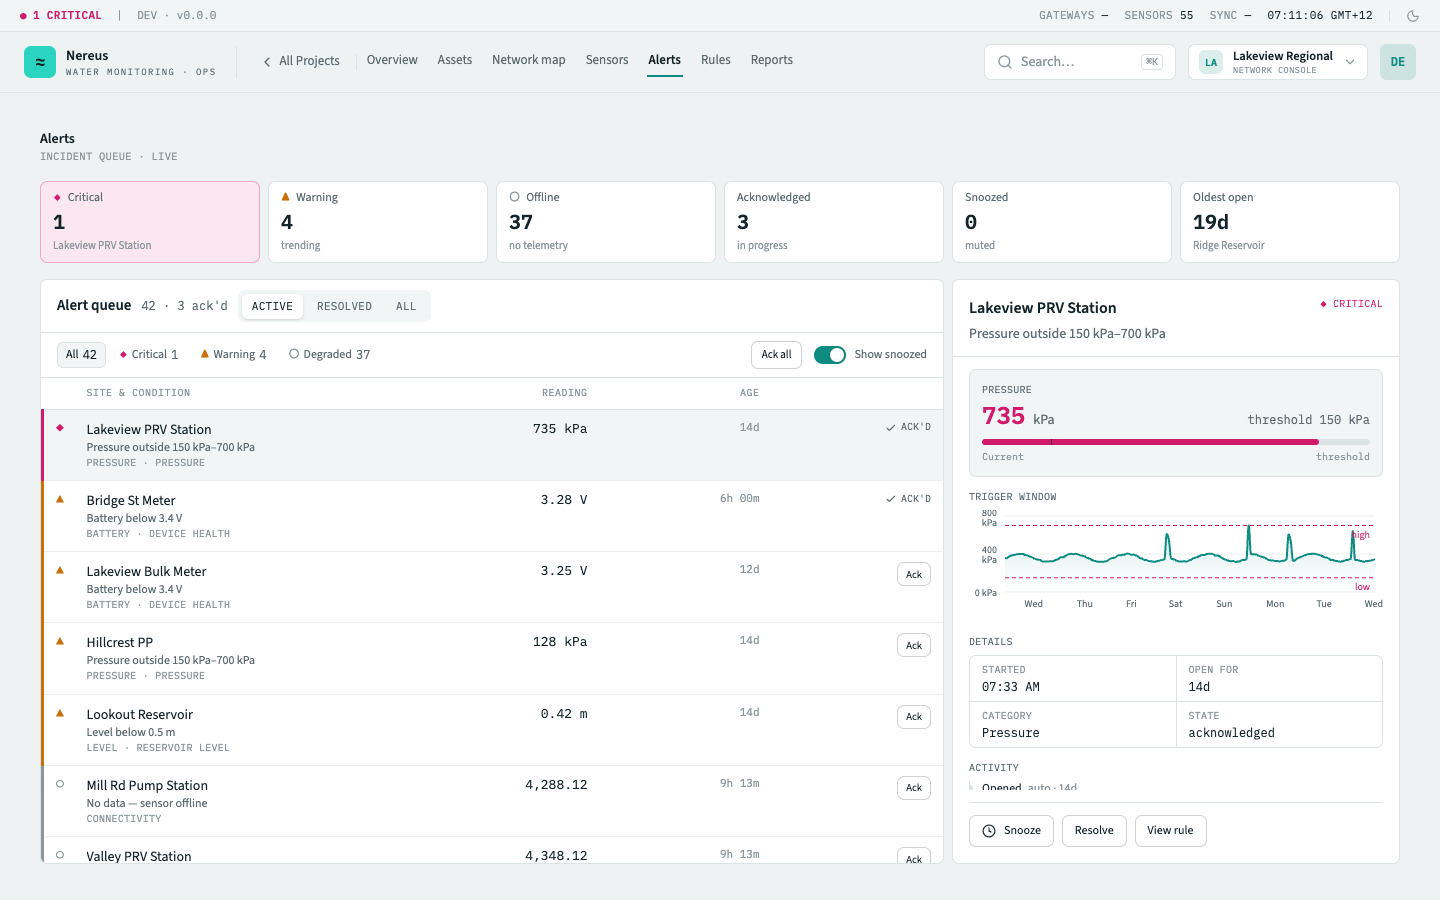
The alerts screen is the operational hub for incident awareness — a real-time queue of triggered
alerts, the set of rules that generate them, and the tools for acknowledgement and triage. It
covers both the alert queue tab (/projects/:id/alerts) and the rules tab (/projects/:id/rules).
What you see
Section titled “What you see”Alert severity
Section titled “Alert severity”Every alert carries a severity level that determines its visual prominence and notification behaviour:
| Severity | Meaning | Example |
|---|---|---|
| Critical | Immediate risk to infrastructure or safety; triggers highest-priority notification | Reservoir level below dead storage |
| Warning | Anomalous reading approaching threshold; triggers standard notification | Flow rate exceeds design capacity |
| Offline | Sensor has stopped reporting — no telemetry received | Staleness exceeds 6× device cadence |
You set Critical or Warning on a rule; Offline is raised automatically by the staleness
detector (a stale comparator), not chosen by hand.
Alert queue
Section titled “Alert queue”The queue is a real-time feed of every alert that has fired, ordered by recency. Each row shows the severity badge, alert title, affected asset/sensor, time since trigger, and acknowledgement status. The scrubber widget filters by “all / active / acknowledged”.
Click any row to expand an alert detail panel showing the triggering condition, the metric value that breached the threshold (with a sparkline of the 24-hour lead-up), the rule definition, and the acknowledgement history with timestamps.
Alert notifications
Section titled “Alert notifications”Alerts don’t just wait in the in-app queue — when a rule opens an alert, HydroScope also emails the team. The notification names the rule, the affected asset, the value that breached and the threshold it crossed, the severity, and the local time it triggered (in your organisation’s time zone, never a bare UTC time), with a link straight to this screen.
Who gets emailed: every active member of the organisation whose role is Operator or above — Operators, Engineers, Admins, and Owners. Viewers can watch the queue but are not paged. The list is deduplicated by email address, so a member with several grants is emailed once.
This is a single organisation-wide rule today: there is no per-user or per-alert opt-in, and no settings toggle to subscribe or mute — so don’t go hunting for one. Being paged is a consequence of holding an Operator-or-above role. Per-user notification preferences (choosing which alerts reach you, and over which channel) are a planned future capability, not a shipped feature.
Rule list
Section titled “Rule list”Switch to the Rules tab to see every alert rule configured for the project.
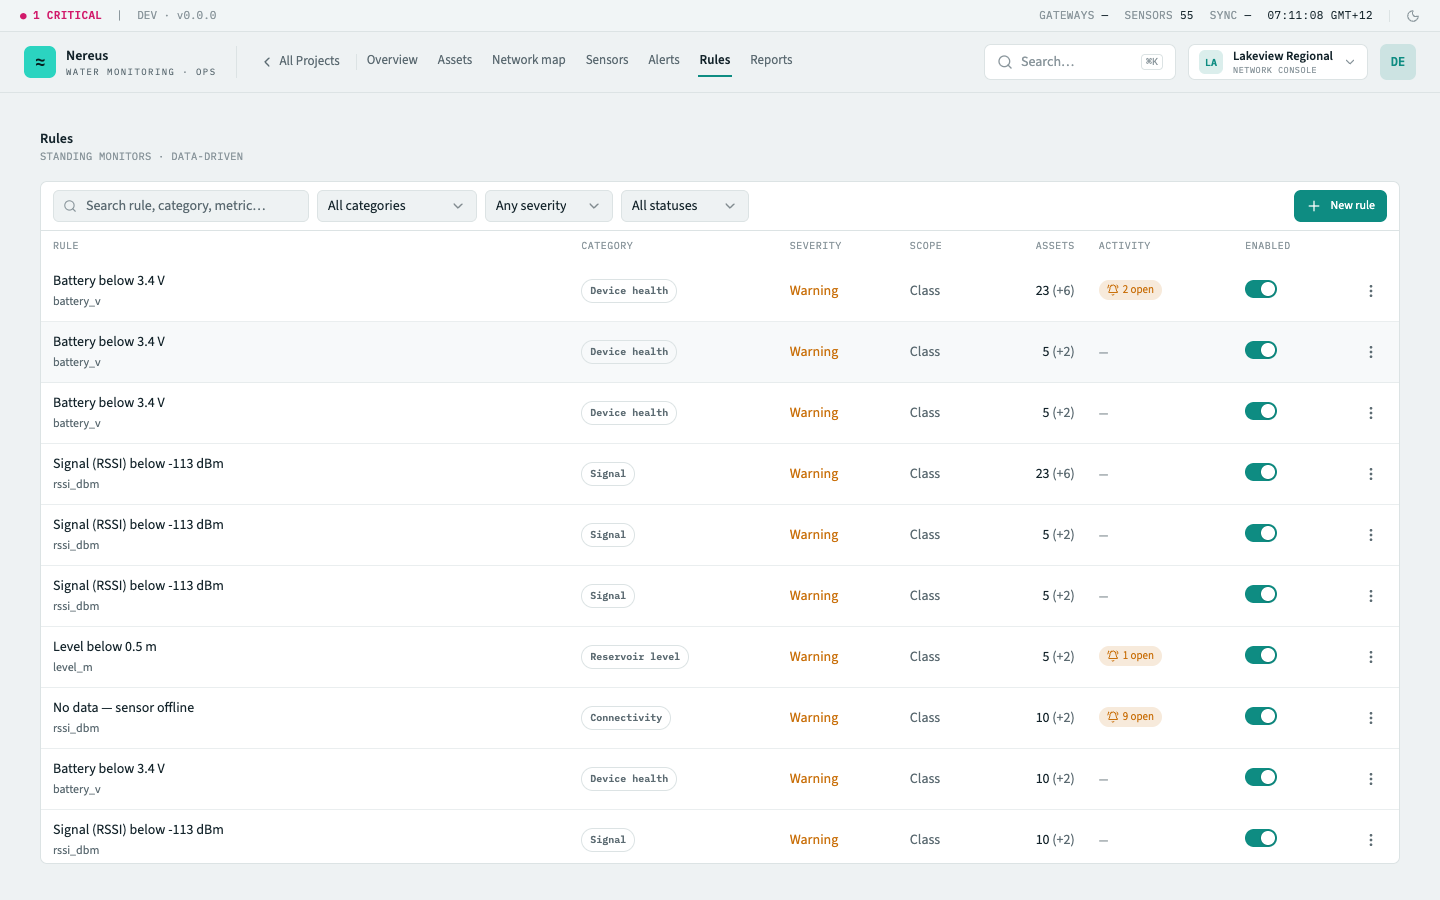
Each rule row shows the rule name, condition summary (e.g. “level_m falls below 0.5 m (×2)”), target scope (an asset, a class, or a group), and whether it’s active or paused. The scrubber toggles between “all / active / paused”.
Rule editor
Section titled “Rule editor”Click Create rule or edit an existing rule to open the rule editor — a sentence-style form in four sections:
- Target — what it watches: an asset, an asset class, or a group.
- Condition — the metric, comparator, and threshold (e.g. “Alert when
level_mfalls below 0.5 m”). - Reduce false alarms — the debounce count and an optional clear value (hysteresis).
- Classification — the severity (Warning or Critical) and a category label.
The debounce confirms the condition over N consecutive readings before opening, so transient blips don’t trigger false alarms. The optional clear value governs resolution — the metric must recover past it before the alert clears (it defaults to the trip value when omitted).
Key interactions
Section titled “Key interactions”Acknowledge — click Acknowledge on any alert row to mark it as seen. Acknowledged alerts stay in the queue but are dimmed. Acknowledge notes are optional and visible on the detail panel.
Create rule — opens the rule editor form. Rules are active immediately on save unless the Paused toggle is set.
Edit / pause / delete rule — from the rule row’s overflow menu. Pausing a rule keeps its configuration but stops it from firing (and any existing alerts from it remain active). Deleting a rule removes it permanently; existing alerts stay in the queue with the rule annotated as “deleted”.
Bulk acknowledge — select multiple alert rows and click Acknowledge selected.
Related
Section titled “Related”-
Act on alerts from the Action Centre — cross-project triage with guidance
-
Sensors — device health context for offline alerts
-
Project overview — the network health strip summarises alert posture