Alert Rules
An alert rule is a persistent condition that the evaluator checks against incoming telemetry. When a rule trips, it opens an alert; when the condition clears, the alert resolves. Rules are the engine behind the alert feed — they turn raw metrics into actionable incidents.
Comparators
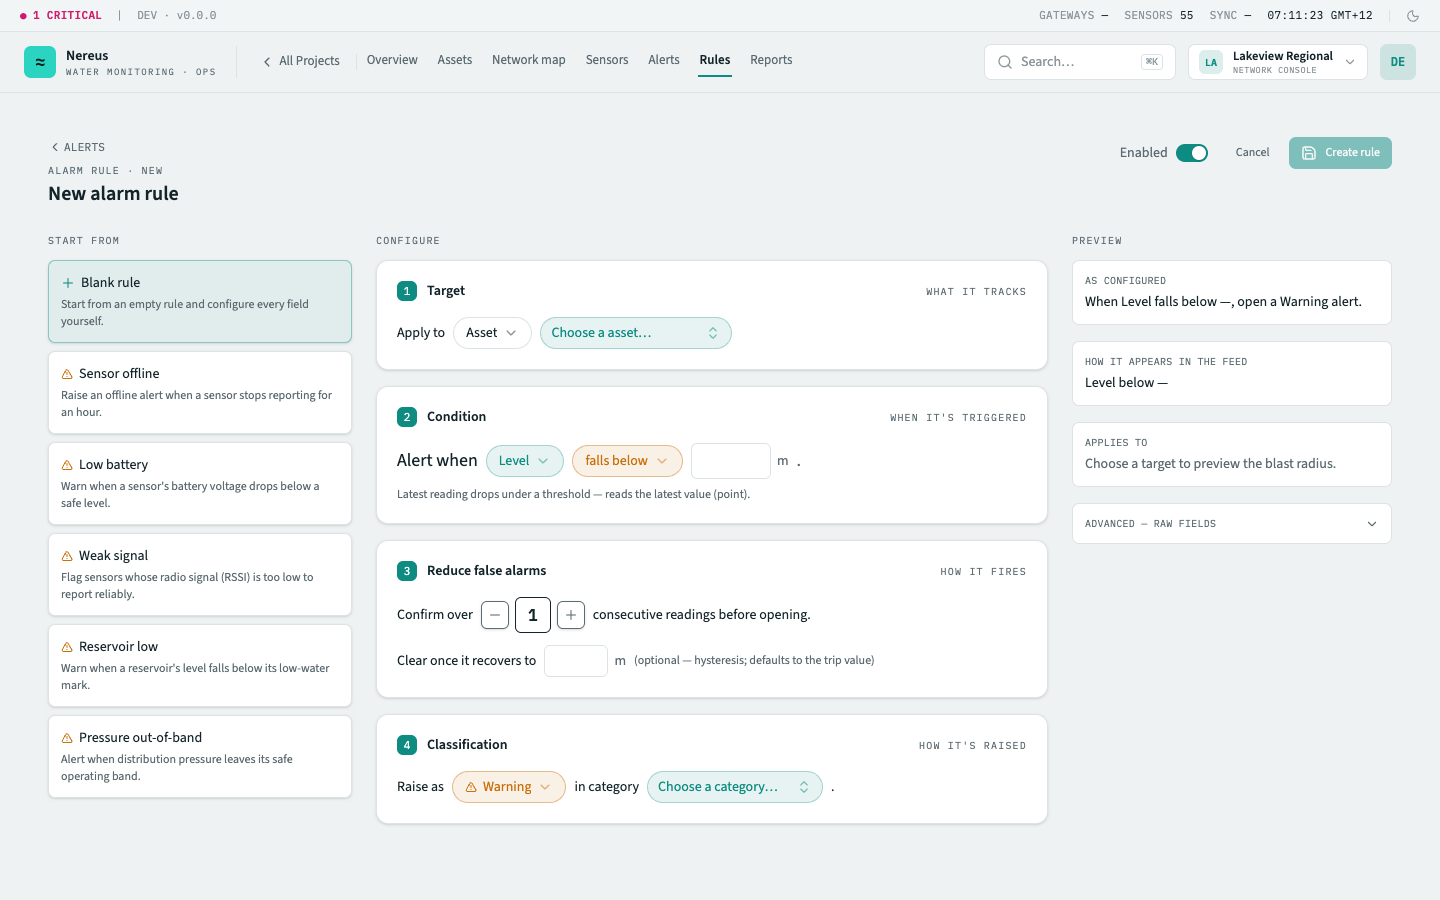
Section titled “Comparators”A rule’s comparator decides how it tests the metric. HydroScope supports seven, grouped by what they read — the latest value (a point), a trailing window, or the absence of data:
| Comparator | What it detects | Example |
|---|---|---|
lt |
Latest reading falls below a threshold | Battery voltage below 3.4 V |
gt |
Latest reading rises above a threshold | Pressure above 700 kPa |
outside_band |
Latest reading moves outside a low–high band | Pressure outside 150–700 kPa |
rate |
The metric changes faster than a limit over a window | Level dropping more than 2 m/h |
pct_over_baseline |
The metric exceeds a baseline by a percentage over a window | Flow 40% above its baseline |
min_over_window |
A flow’s window minimum stays above a floor — a continuous leak | 24 h minimum flow above 3 L/min |
stale |
A sensor reports no data for a window — raised as an offline alert | No uplink for 6× device cadence |
lt, gt, and outside_band read the latest value (a point). rate, pct_over_baseline, and
min_over_window aggregate a trailing window over the continuous aggregates — min_over_window is
the continuous-flow / customer-side-leak detector and is valid only for flow metrics. stale is
different in kind: it fires on the absence of data (now − last_seen) rather than a value, and its
alert is always surfaced as offline.
Value and band comparators use a debounce (the “confirm over N consecutive readings” clause) so transient blips don’t trigger false alarms. An optional clear value adds hysteresis — the metric must recover past it before the alert resolves (it defaults to the trip value when omitted).
Severity levels
Section titled “Severity levels”Every rule has a severity that determines the alert’s visual prominence and notification behaviour:
| Severity | Meaning | Example |
|---|---|---|
| Critical | Immediate risk to infrastructure or safety | Reservoir level below dead storage |
| Warning | Anomalous reading approaching or breaching a non‑critical threshold | Pressure above design capacity |
| Offline | Sensor stopped reporting — generated by the staleness detector, not a user rule | No uplink for 6× device cadence |
Severity is colour‑vision‑safe: shapes and weights supplement colour so critical and warning alerts are distinguishable without relying on hue alone.
Rule lifecycle
Section titled “Rule lifecycle”Every alert passes through five states, driven by the evaluator sweep and user action:
Rule created → Evaluator checks latest readings ├── Condition met (× debounce count) → Alert opens │ ├── User acknowledges → Alert stays open, dimmed │ │ └── Condition clears → Alert resolves │ └── Condition clears (unacknowledged) → Alert resolves └── Condition not met → SilentCreate — a rule is authored via the rule editor and saved. It becomes active immediately unless the Paused toggle is set. The evaluator sweep runs periodically (aligned with the telemetry pipeline) and checks every active rule against the most recent readings.
Evaluate — the evaluator loads the rule’s target asset(s) and metric, fetches the debounce window’s worth of readings, and applies the comparator. If the condition holds for the full debounce count, the rule trips.
Fire — a new alert opens with the triggering value, severity, and rule metadata. It appears in
the alert feed immediately and is emailed to every member with role Operator or above (see
alert notifications). If an alert already exists for the same
(rule, asset) pair and is still open, the evaluator adopts it — no duplicate is created.
Acknowledge — a user clicks Acknowledge on an alert row, or acknowledges it from the Action Centre. The alert stays in the queue but is dimmed and annotated with the acknowledging user and timestamp. Acknowledgements are permanent and visible in the alert detail panel’s timeline.
Resolve — when the condition clears for the full debounce window, the evaluator resolves the alert. Resolved alerts leave the active queue but remain in the alert history table with a resolution timestamp. They cannot be reopened.
Rule scope
Section titled “Rule scope”A rule targets one of three scopes:
| Scope | Coverage | Example |
|---|---|---|
| Asset | One specific asset | pressure_kpa outside 150–700 kPa on the Lakeview PRV station |
| Class | Every asset of a given class (data-driven — new assets of the class inherit it) | battery_v below 3.4 V on every water meter |
| Group | Every asset beneath a group in the hierarchy | level_m low across the North Basin region |
When more than one rule targets the same (asset, metric), the evaluator resolves
most-specific-wins: an asset-scoped rule overrides a class-scoped one, which overrides a
group-scoped one. This lets you set a broad class or group baseline (e.g. a wide pressure band for
all pressure points) and tighten it for a critical asset with lower tolerances.
Related
Section titled “Related”- Rules screen — the rule editor and list
- Alerts screen — the alert queue, acknowledgement workflow, and notifications
- Act on alerts from the Action Centre — triage open alerts across projects
- Metrics & telemetry — the metrics comparators read, and the staleness model behind
stale - Comparators — the seven comparators as a lookup (required fields, valid kinds)
- Assets & groups — asset classes define rule scope