Quickstart
This is the end-to-end path a new operator can follow to go from nothing to a live, monitored network: create a project, build its structure, enrol a sensor, watch data arrive, set an alert, and see it on a dashboard. Each step links to the how-to or concept that covers it in depth — follow those when you want detail; stay here for the through-line.
You’ll need an account with the Engineer role or above (most of these steps configure the project). If you’re only reading data, you can still follow along — you just won’t be able to save.
1. Create a project
Section titled “1. Create a project”A project is an operational workspace with its own assets, rules, dashboards, and reports. From the Portfolio landing screen, click New project and give it a name.
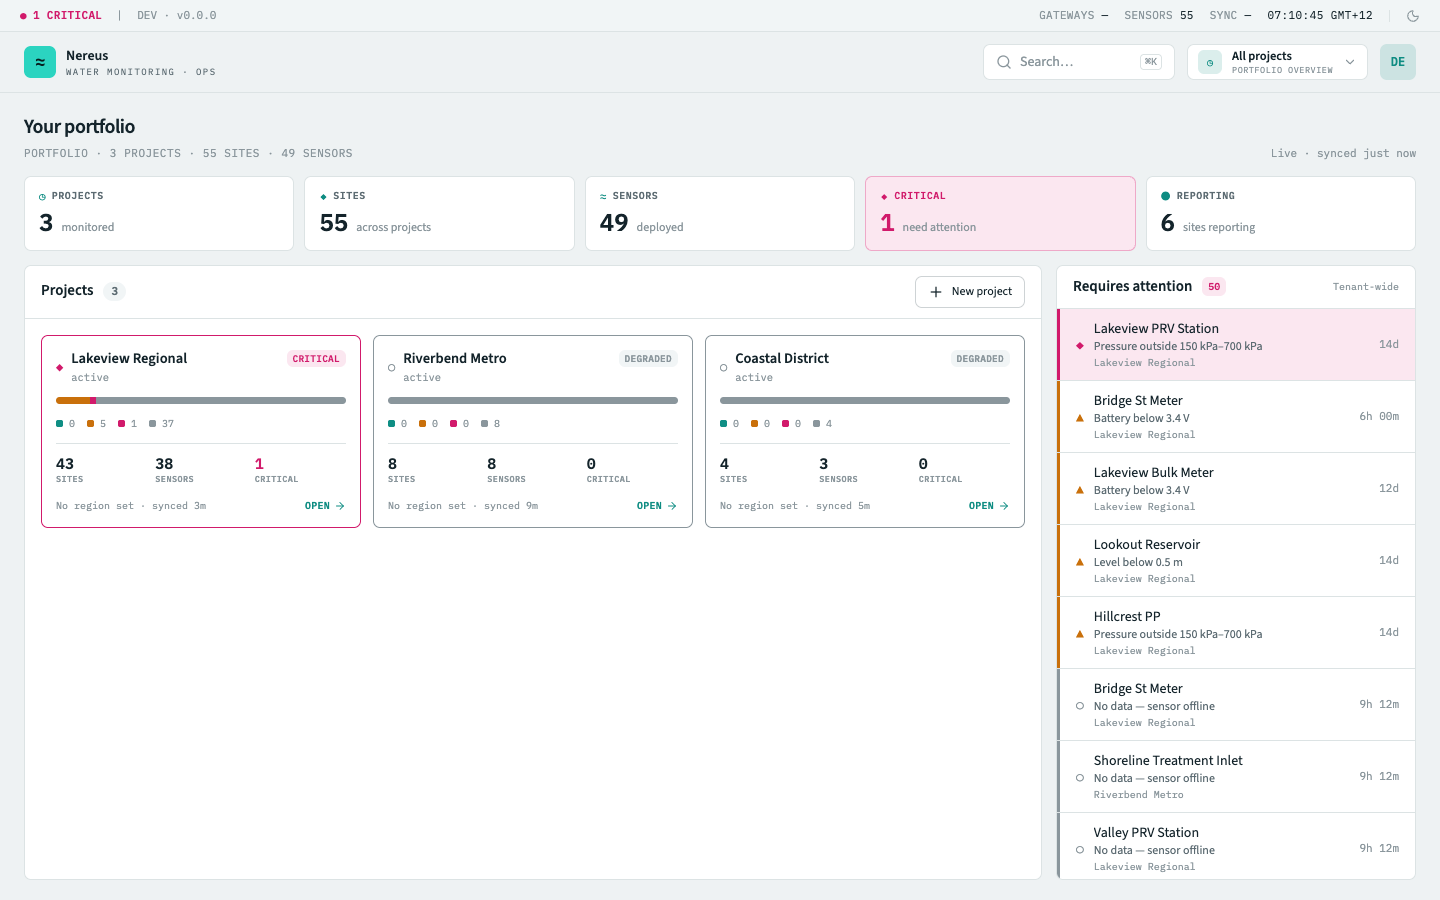
→ Portfolio screen · Projects & access
2. Build the group tree
Section titled “2. Build the group tree”Assets live in a region → zone → site tree of asset groups. Build the skeleton first so assets have somewhere to hang — add a region, then zones beneath it, then sites. The group sidebar on the assets and map screens reflects this tree and filters everything you view.
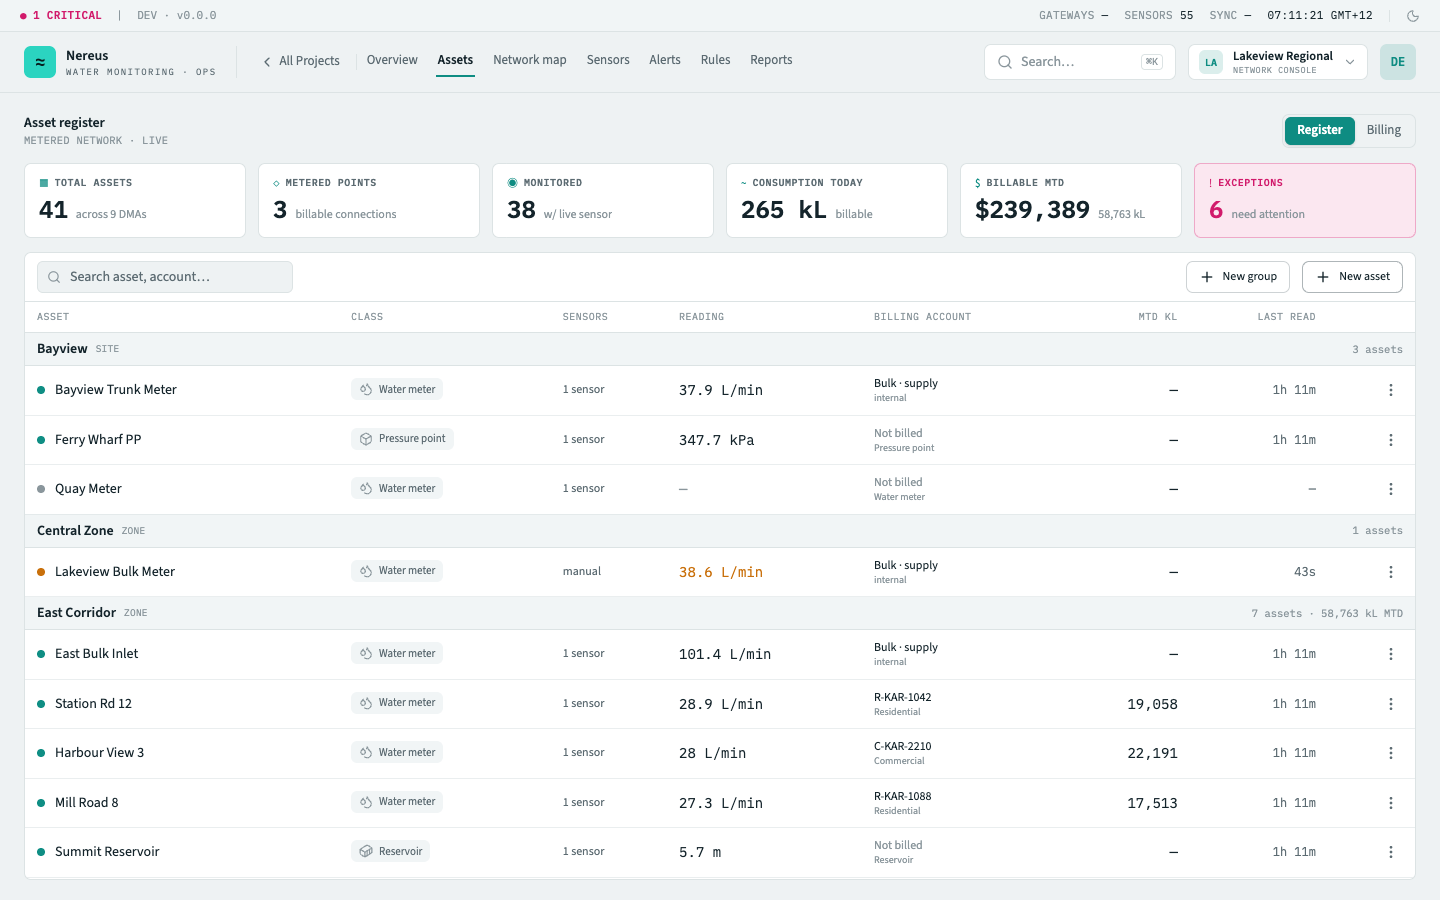
3. Add assets
Section titled “3. Add assets”Add the physical infrastructure you’re monitoring — reservoirs, pump stations, meters, pressure points. Each asset has a class that sets its icon, its metrics, and how alert rules can target it. Place each asset in the right site as you go.
4. Enrol a sensor
Section titled “4. Enrol a sensor”Connect a physical LoRaWAN sensor: paste its DevEUI, pick the device profile that matches the model, and (optionally) attach it to an asset. From here on, every uplink from that sensor is decoded onto the canonical metrics.
→ How to enrol a sensor (with a walkthrough video) · Device profiles
5. Watch data arrive
Section titled “5. Watch data arrive”A freshly enrolled sensor sits under Awaiting with a last‑seen of Never — its shadow is empty until the first uplink. When that uplink lands (typically within the device’s cadence), the sensor moves to Live and its battery / signal columns populate. Open the Sensors screen and its detail sheet to watch the readings accumulate.
→ Sensors screen · Metrics & telemetry
6. Set a first alert rule
Section titled “6. Set a first alert rule”Turn a raw metric into an incident. Author a rule — pick a target (asset, class, or group), a metric and comparator (e.g. level falls below 0.5 m), a debounce to suppress blips, and a severity. When it trips, it opens an alert and emails everyone with the Operator role or above.
→ How to create an alert rule · Alert rules · Alert notifications
7. See it on a dashboard
Section titled “7. See it on a dashboard”Finally, surface your network at a glance. Every project has a shared Operations Overview dashboard; enter Customize and add widgets — a reading card bound to your new asset, a network-health rollup, an alert feed — then arrange the grid and save.
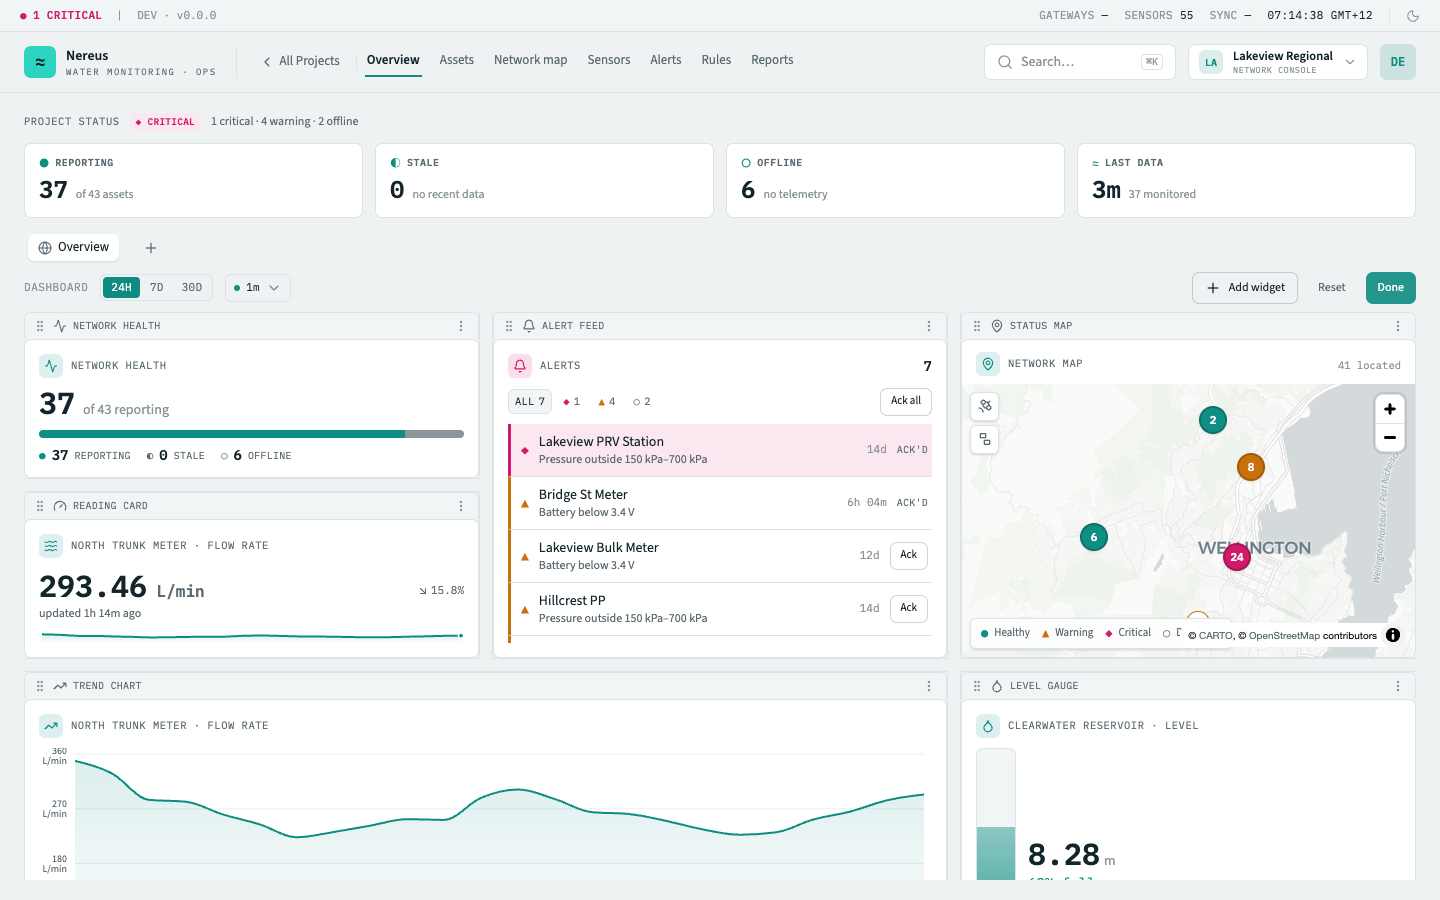
→ How to build a dashboard · Dashboards · Project overview
Where to next
Section titled “Where to next”- Build a report — turn the same data into a scheduled PDF
- Glossary — the domain vocabulary in one place
- Command palette — ⌘K to jump anywhere