Dashboards
A dashboard is a configurable grid of widgets that displays real-time telemetry, sensor health, alert summaries, and key performance indicators for a project. Each project has one shared Operations Overview dashboard visible to every member, plus any number of personal dashboards private to their owner.
Widget types
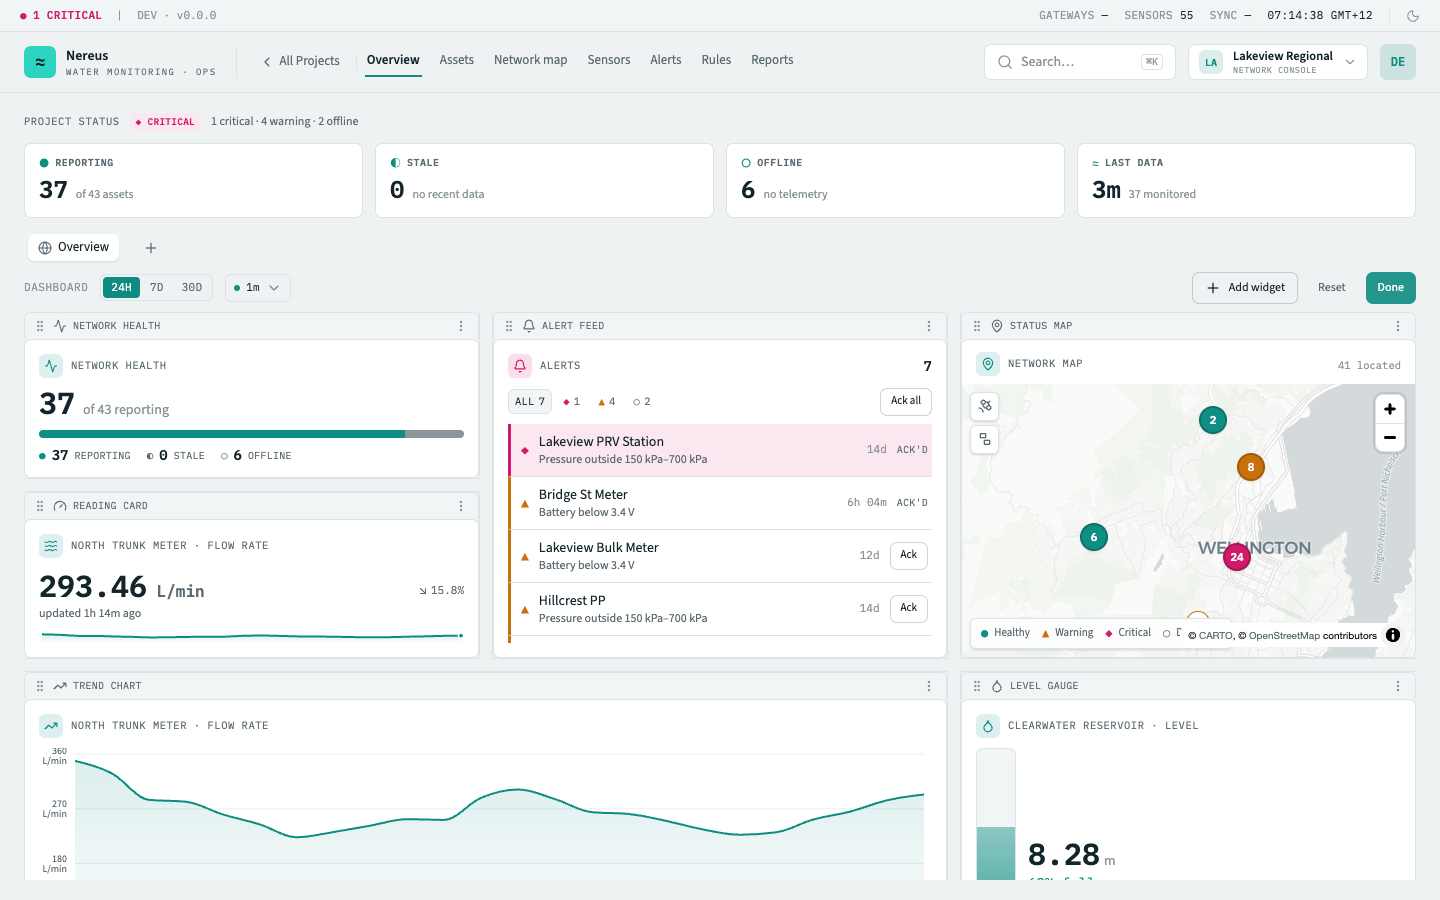
Section titled “Widget types”The dashboard supports twelve widget types, each designed for a specific monitoring concern. Below are three representative renderings — the kit primitives that drive the real console widgets:
| Widget | Purpose | Binding |
|---|---|---|
| Network health | Project-wide reporting / stale / offline rollup | Project-scoped |
| Reading card | Latest value + 24h trend for one asset metric | Entity-bound (asset + metric) |
| Trend chart | A metric charted over time for one asset | Entity-bound · time-ranged |
| Sensor health | Battery, signal, and last-seen across the project’s sensors | Project-scoped |
| Level gauge | A reservoir or tank’s level as a fill against its capacity | Entity-bound (reservoir) |
| Water balance (NRW) | Bulk inflow vs a zone’s summed meters — the loss + non-revenue-water % | Entity-bound · time-ranged |
| Alert feed | The project’s active alerts, worst-first — acknowledge from the feed | Project-scoped |
| Status map | The project’s located assets on a map, coloured by status | Project-scoped |
| Night-flow leaderboard | District metered areas ranked by minimum night flow — worst leakers first | Project-scoped |
| Minimum night flow | A district’s minimum night flow trended over weeks | Entity-bound (DMA) · time-ranged |
| Pressure compliance | Pressure points ranked by how much of the week they ran outside their band | Project-scoped |
| Pressure vs band | A pressure point’s pressure trended against its operating band | Entity-bound · time-ranged |
Customization
Section titled “Customization”Add, remove, and reorder
Section titled “Add, remove, and reorder”Click Customize in the dashboard header to enter edit mode. From the Add widget button, a wizard lets you browse all widget types with live previews and configure entity-bound widgets — for example, choose which asset and metric a reading card tracks. Each tile becomes draggable (grab the header strip) and resizable (drag the bottom-right corner). The Remove option sits in the tile’s overflow menu. Click Done to save and exit edit mode.
Resize and layout
Section titled “Resize and layout”The grid uses a 12-column layout. Every widget type declares a default size and a minimum size so the grid always fits the viewport. Tiles snap to column boundaries as you drag — no fractional placements.
The Reset button in customize mode reverts the dashboard to its project default layout. This is per-dashboard: resetting your personal dashboard does not affect the shared one.
Personal vs. shared dashboards
Section titled “Personal vs. shared dashboards”- Shared dashboard — one per project, named Operations Overview. Visible to every project member. Only the shared dashboard appears to all members; editing it affects everyone.
- Personal dashboards — private to you. Create them from the + tab in the dashboard switcher. Personal dashboards are ideal for role-specific views — a field operator’s dashboard might focus on battery health and staleness, while a planner’s dashboard shows reservoir trends and NRW metrics.
When a personal dashboard exceeds six tabs, the overflow collapses into a “+N more” menu.
Time range and refresh
Section titled “Time range and refresh”The time range picker (24h / 7d / 30d) sets the window for every time-series widget on the dashboard at once — changing it refreshes all trend charts, balance widgets, and MNF trends together. A separate auto-refresh dropdown enables periodic data refresh at 30-second, 1-minute, or 5-minute intervals. A pulsing green dot indicates refresh is active.
Related
Section titled “Related”- Project overview — the dashboard landing page in context
- Assets & groups — how assets appear in entity-bound widgets
- Alert rules — rule evaluation feeds the alert feed widget