Build a Dashboard
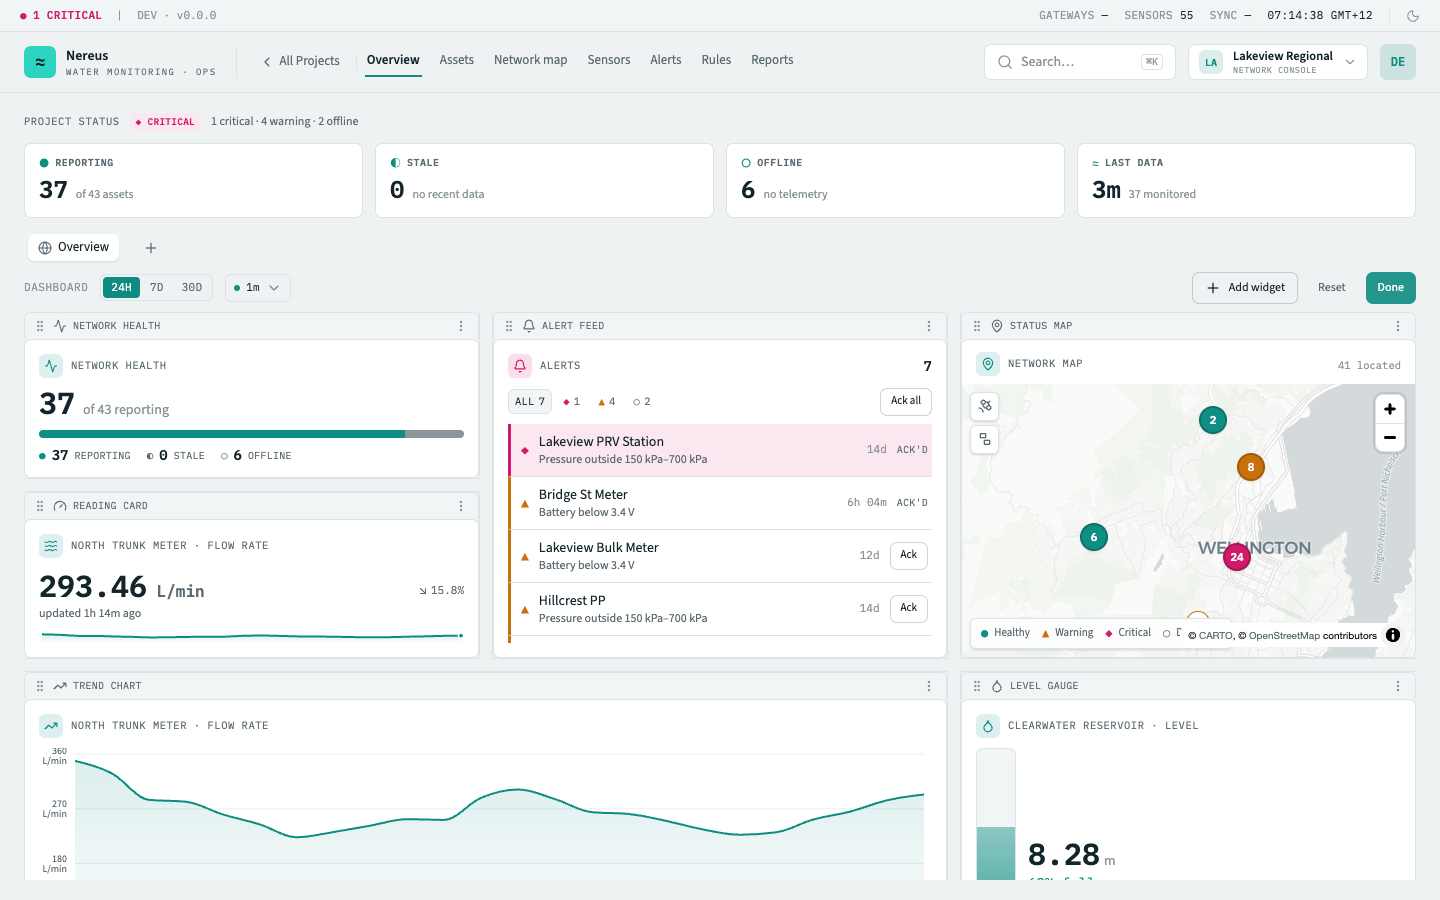
A dashboard is a grid of widgets showing live telemetry, sensor health, alerts, and KPIs for a project. This guide walks through adding a widget to a dashboard and arranging the layout. For the widget catalogue and the concepts behind them, see Dashboards.
Prerequisites
Section titled “Prerequisites”- Engineer, Admin, or Owner role — customizing a dashboard needs the
dashboard:editcapability. (Personal dashboards are yours to arrange; the shared Operations Overview is edited for everyone, so it’s gated.) - A project with at least one asset and metric, so entity-bound widgets have something to bind to.
-
Open the dashboard from the project’s Overview, and pick which dashboard to edit — the shared Operations Overview, or one of your personal dashboards from the dashboard switcher (create a new one with the + tab).
-
Click Customize in the dashboard header to enter edit mode. Tiles become draggable and resizable, and the add/reset controls appear.
-
Click Add widget to open the widget wizard. Browse the twelve widget types with live previews — some are project-scoped (like Network health or Alert feed) and need no configuration; others are entity-bound and need you to choose what they track.
-
Configure an entity-bound widget. For a Reading card or Trend chart, pick the asset and the metric it should follow (e.g. Lakeview Reservoir → Level). Time-ranged widgets inherit the dashboard’s range picker. Confirm to drop the tile onto the grid.
-
Arrange the layout. Drag a tile by its header strip to move it and drag the bottom-right corner to resize — the grid is 12 columns and tiles snap to column boundaries. Each widget has a minimum size so the layout always fits.
-
Remove any widget you don’t want from its tile overflow menu, or hit Reset to revert the dashboard to its project default layout.
-
Click Done to save and exit edit mode. Your layout persists — the shared dashboard for everyone, a personal dashboard just for you.
After building
Section titled “After building”Use the dashboard header’s time range (24h / 7d / 30d) to move every time-series widget at once, and the auto-refresh dropdown (30s / 1m / 5m) to keep the data live. A pulsing green dot means refresh is on.
Related
Section titled “Related”- Dashboards — the full widget catalogue and customization model
- Project overview — the dashboard landing page in context
- Metrics & telemetry — the metrics entity-bound widgets bind to